 Back to Blog
Intelligence in Huntbase: from a feed to a tested detection
Threat intel and detection content live in one place in Huntbase. New intel is checked against your telemetry as it arrives and against the last 30 days, threats are ranked by how much they apply to you, and every detection rule is tested against recorded real-world attacks, backtested and measured for precision before it pages anyone.
TL;DR: Huntbase has an Intelligence area. It brings your threat intel and your detection content into one place, and connects both to the data you already have. When new intel arrives, it is checked against your telemetry going forward and against the last 30 days. Threats are ranked by how much they apply to your environment. Every detection rule is tested against recorded real-world attacks, backtested on your lake and measured for precision before it is allowed to page anyone.
The problem we kept running into
Most teams run intel and detection as two separate systems.
- Indicators live in a platform or a spreadsheet. They get pushed into a SIEM lookup table and are rarely looked at again. Nobody can say which feed has ever caught anything.
- Detection rules live in a repo or in the SIEM itself. They get tuned by complaint. A rule is "good" until it floods the queue, then it is "off".
- The two rarely meet. A report lands about an actor who goes after your identity provider. Answering "do we cover those techniques, and have we seen their infrastructure?" means an afternoon of clicking.
Huntbase already had most of the parts: feed ingestion, a graph of your environment, SIGMA-based watchers, and hunts. What was missing was a home where intel and detection content are the same kind of object, with the same questions asked of them. Where did this come from? Does it apply to us? Has it fired? Is it any good?
A note on names: in Huntbase, detection rules are watchers. A watcher fires on matching data, a firing can create a detection, and a detection starts a hunt or another workflow. Intelligence is where you find out which of your watchers deserve that trust.
What's in Intelligence
Intelligence sits in the nav next to Library and Connections. It has six tabs (docs).
- Overview. What in your environment matches intel right now, whether your feeds are healthy, and which threats apply to you.
- Indicators. Search and filter by type, source, TLP, confidence, first and last seen, and whether an indicator has been seen in your environment. You can also paste up to 10,000 values for a bulk lookup. Defanged values like
hxxp://andevil[.]comare handled. (docs) - Threats. Actors, malware, campaigns and reports, each with a relevance score and the reasons behind it. (docs)
- Feeds. Shared feeds to subscribe to, plus your own private TAXII 2.1 and MISP feeds. Each shows its health, volume and overlap with your other feeds. (docs)
- Watcher health. Your watchers, with test status, readiness, mode, 7-day volume, precision and when each one last fired. (docs)
- Coverage. An ATT&CK heatmap showing live watchers, hunt-only coverage and gaps. The techniques used by threats that apply to you are highlighted. (docs)
Intel that reaches your data, in both directions
An indicator is only useful if something checks it. Huntbase checks it in two directions.
Forward, as telemetry arrives. Active indicators are held in memory next to the stream that already evaluates your SIGMA rules. That keeps checking cheap: a network event that matches nothing costs tens of microseconds, and there is no lookup call per event. A match records a sighting against the real indicator. From there it can open a finding, go into the digest or start a hunt, depending on how you've set up that watcher.
Backward, when intel arrives. New intel is often about activity that has already happened. When a feed adds indicators, a retro-hunt checks them against your recent telemetry, 30 days by default. It does this in batched, capped queries, so it doesn't compete with your analysts' queries. You can also select any set of indicators and choose Hunt last N days yourself.
Watch lists. Values from an incident or a partner's bulletin can be saved as a watch list. Watch lists are matched the same way as feeds.
Threats ranked by how much they apply to you
A list of 900 actors is not useful. Threats in Huntbase are ranked against your own environment, and each one tells you why:
- it targets products you have connected;
- it exploits a CVE from CISA's Known Exploited Vulnerabilities list on software you own, and on how many hosts;
- it uses ATT&CK techniques you don't have a live watcher for;
- indicators linked to it have been seen in your environment in the last 30 days. This one ranks it highly whatever else is true.
From a threat you can go straight to the watchers that cover its techniques, or start a hunt from its uncovered ones. And you can ask whether a rule would actually catch the actor: Scout runs it against recorded emulations of the campaign and answers with the recordings it used.

Detection content, managed like code
This is the part we are most excited about. Detection rules go through a lifecycle, and each stage leaves evidence behind.
- Import. Write your own rules, or enable the SigmaHQ community rules for your organisation. Huntbase fetches them from SigmaHQ for you, and they arrive switched off. Rules that can't run on your data are grouped by reason, for example a field that isn't mapped for process activity. That list is a to-do list for coverage, not a silent failure.
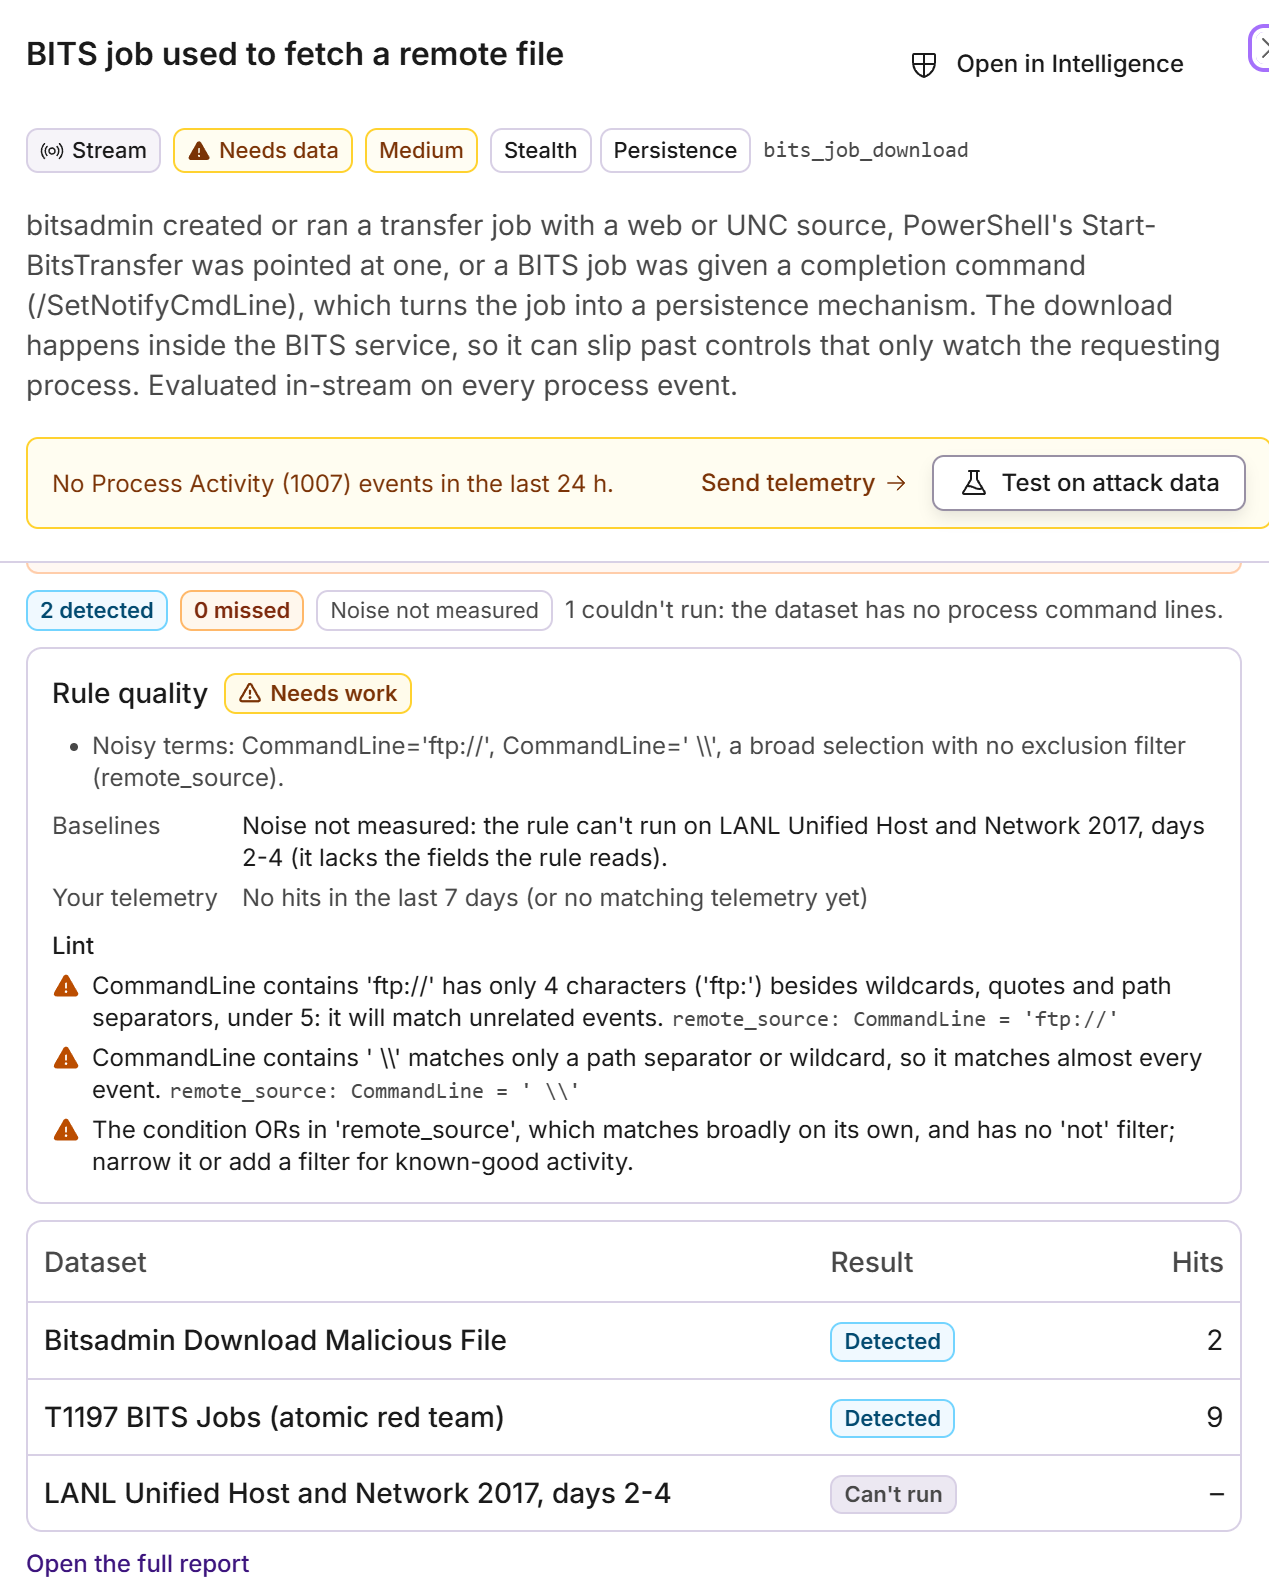
- Test against real attacks. Every rule can carry fixtures: events it must match and events it must not match. Each rule in our own catalog ships with them, and they run on every change. Then test the rule against the attack itself. From any watcher or rule page, Test on attack data runs it against every recording in the Huntbase test lake that matches its ATT&CK techniques: more than 1,250 recorded attacks, plus baselines of real enterprise activity. In about 10 seconds you know which recordings it detects, which it misses, and which it can't run on because the data lacks the fields it reads.
- Fix what it missed. For every miss, the test report names the clause that blocked the match and shows what the attack did leave behind. A rule that matches
Image: powershell.exeon the APT29 emulation is flagged because the Image clause matched none of the 40,644 Process Activity events: Image holds full paths, and 24 of them end with\powershell.exe. The fix is in the report. - Check the noise. The same report runs the rule over real enterprise baselines and your own recent telemetry, then gives one verdict: ready, needs work or noisy. An NTLM network-logon rule that detected its attack was still rated noisy, at about 10.9 million estimated hits on normal activity.
- Backtest. Run a rule over your lake for up to 90 days. Huntbase shows two counts: the fast approximate lake query, and the rule's exact logic run over a sample. When the two disagree, it says so, because backtests that quietly miscount are how bad rules get promoted.
- Shadow. New watchers start in shadow. They are evaluated for real and recorded, but they only go to the digest.
- Promote. Precision is measured from the verdicts your analysts record on the hunts a watcher's detections start. Volume is measured from its firings. When a watcher has run quietly and accurately for long enough, Huntbase suggests turning it on. A staged rollout moves it from shadow to canary to on, and a watcher that suddenly floods is quarantined back to shadow automatically. (docs)
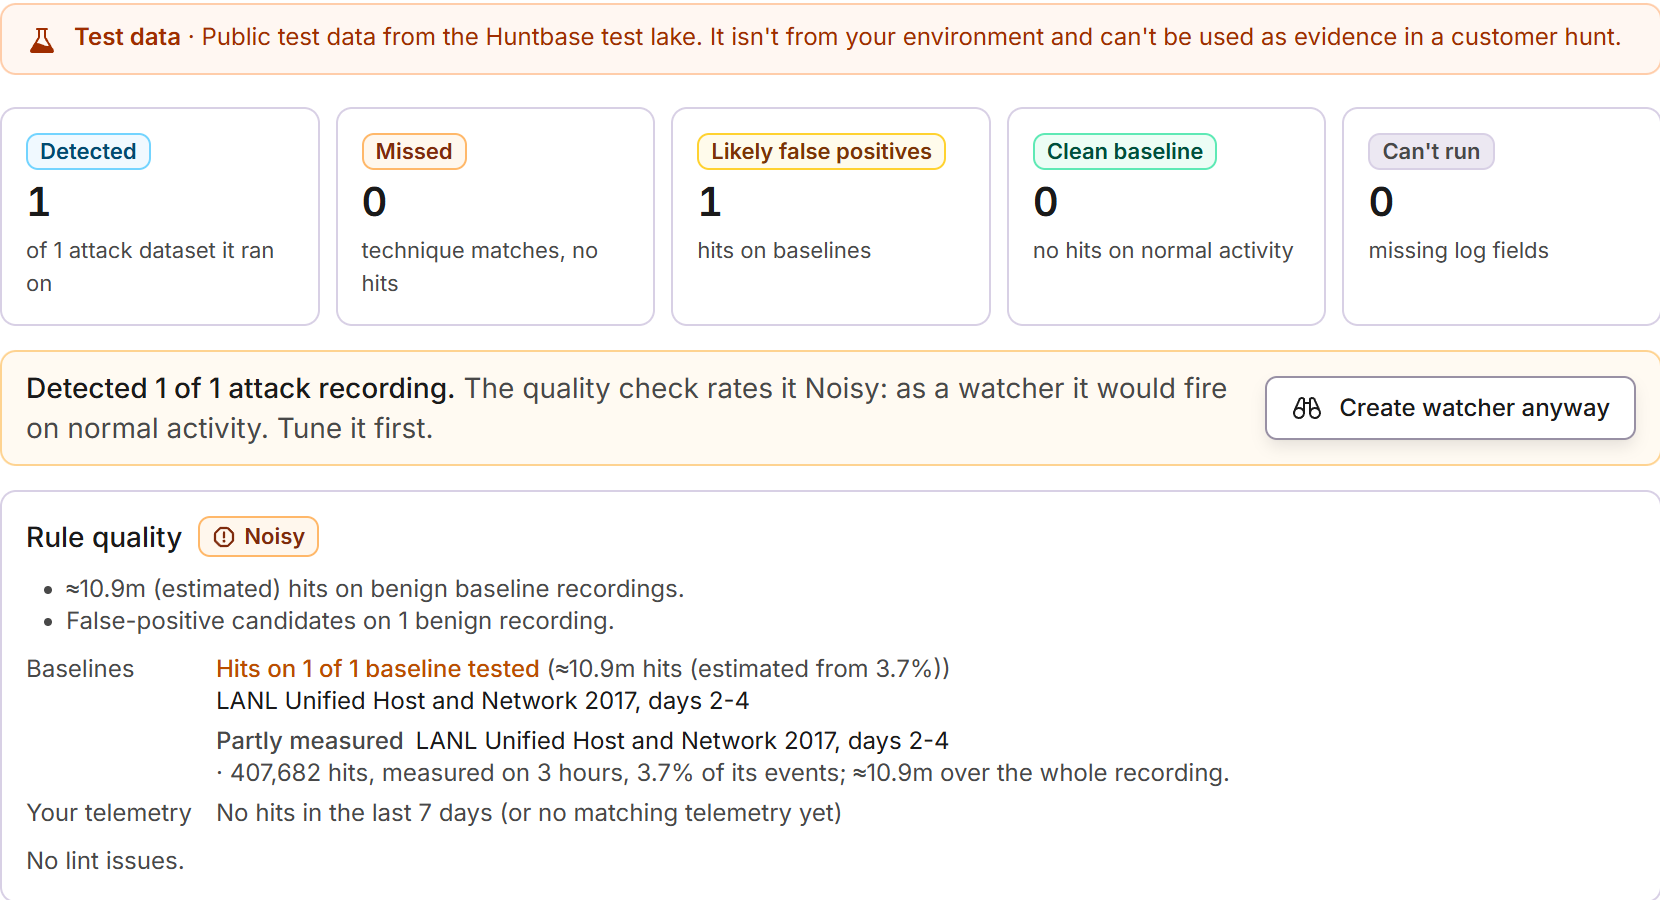

The test lake has its own deep dive: Does your detection actually work? Test it against real attacks first.
Correlation rules. SIGMA correlation rules (event count, value count and temporal ordering) run on the same correlation engine that already powers our cross-source detections.
For data that stays in your SIEM, any rule can be converted to Splunk SPL, Microsoft Sentinel KQL or Elastic ES|QL. You can copy the query or open it in Explorer to run it against your connected SIEM.
From a match to a response, with a second pair of eyes
When an indicator is seen on an endpoint enrolled in Huntbase Endpoint Control, you can choose Respond… on the sighting. You can propose killing a process, quarantining a file or running a script. The proposal goes into a supervised hunt and does not run until a second person approves it. The person who proposed it can't approve their own action.
Scout knows your intel
Scout, our AI analyst, can answer intel questions in chat: which threats apply to you, whether an indicator has been seen, and which techniques you don't cover. Its answers link straight back into Intelligence. (docs)
Your intel stays yours
- Private feeds are private. A TAXII or MISP feed you connect is stored for your organisation only. It is never mixed into the shared intel other customers see or match against.
- Provenance on everything. Every indicator carries its source, confidence, TLP marking, when it's valid from and until, whether it has been revoked, and when it was first and last seen. Revoked and expired indicators stop matching, but past sightings keep their context.
- Shared feeds are ingested once. Public feeds are fetched and stored once for everyone. Each organisation decides whether to match against them, what minimum confidence to use and what should happen on a match.
- Precision reflects your environment. It comes from your own analysts' verdicts, not a vendor's lab.
→ Open Intelligence · Read the docs